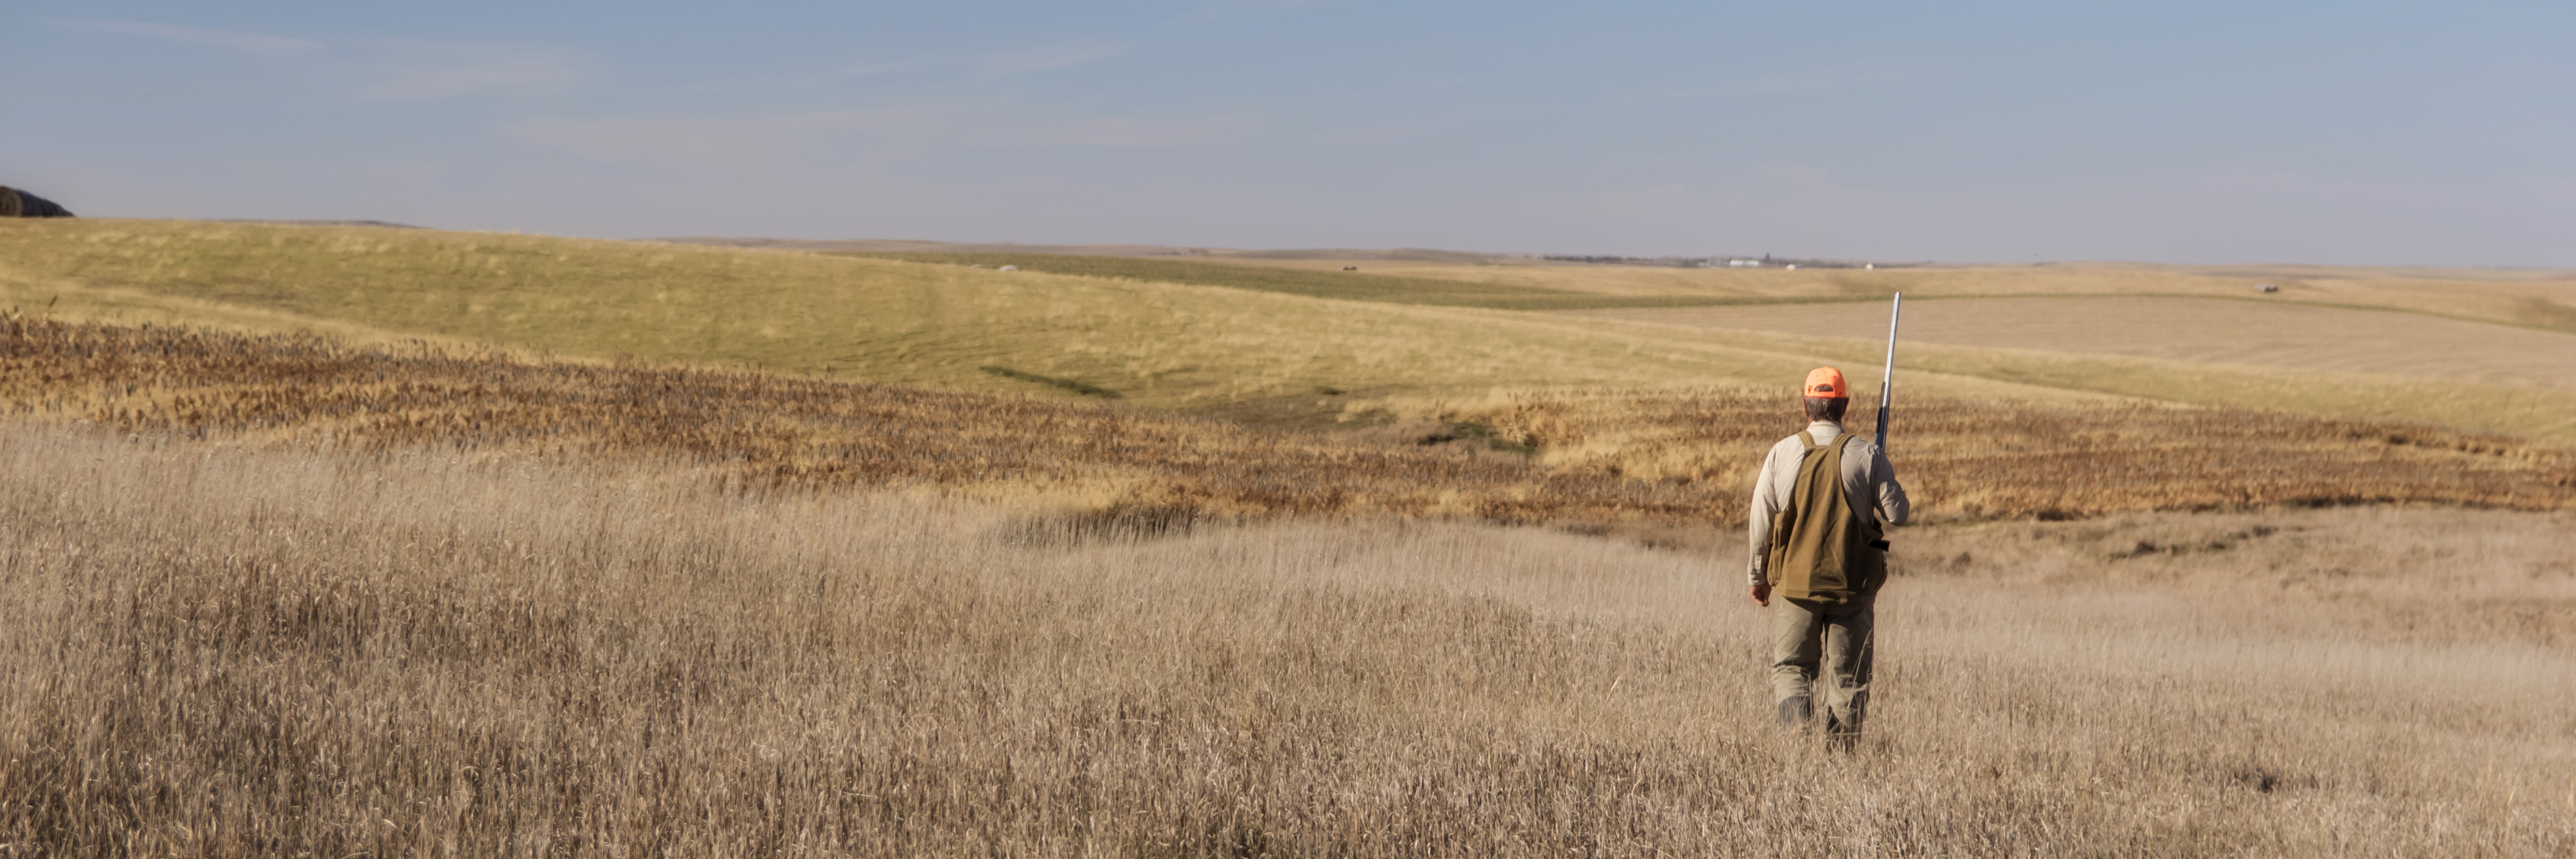
Pheasant Economics
total economic impact from pheasant hunters

Note: Expenditures of resident and nonresident upland game hunters while hunting in South Dakota were obtained from the U.S. Fish & Wildlife Service 2006 National Survey of Fishing, Hunting and Wildlife-Associated Recreation-South Dakota and adjusted for an annual inflation rate of 3%. These county-specific spending estimates were generated by applying mean per-hunter spending estimates to the number and distribution of pheasant hunters as derived from the 2010 SD GFP upland game harvest surveys.
| 2010 | Millions of dollars spent by |
Numbers of Hunters |
Pheasants Harvested |
|||||
|---|---|---|---|---|---|---|---|---|
| County | Res* |
Non-res* |
Total Spent* |
Res |
Non-res |
Total |
Res |
Non-res |
| Brown | $2.3 |
$14.6 |
$17.0 |
4077 |
7730 |
127,026 |
46,707 |
80,319 |
| Spink | $1.4 |
$12.2 |
$13.5 |
2,459 |
6,415 |
109,014 |
34,683 |
74,331 |
| Tripp | $1.2 |
$12.2 |
$13.4 |
2,049 |
6,435 |
97,926 |
25,679 |
72,247 |
| Lyman | $1.3 |
$10.9 |
$12.1 |
2,234 |
5,736 |
103,037 |
33,897 |
69,140 |
| Brule | $1.1 |
$11.1 |
$12.1 |
1,885 |
5,840 |
92,103 |
31,057 |
61,046 |
| Beadle | $1.5 |
$9.4 |
$10.9 |
2,643 |
4,976 |
77,212 |
30,553 |
46,659 |
| Davison | $1.0 |
$9.3 |
$10.3 |
1,762 |
4,935 |
58,744 |
17,603 |
41,141 |
| Hand | $1.2 |
$7.0 |
$8.2 |
2,069 |
3,701 |
70,613 |
27,654 |
42,959 |
| Hughes | $1.4 |
$5.7 |
$7.1 |
2,438 |
3,022 |
68,803 |
38,106 |
30,697 |
| Clark | $0.9 |
$6.2 |
$7.0 |
1,558 |
3,249 |
46,292 |
17,925 |
28,367 |
| Gregory | $0.7 |
$6.1 |
$6.8 |
1,209 |
3,228 |
44,337 |
10,513 |
33,824 |
| Aurora | $1.0 |
$5.4 |
$6.5 |
1,824 |
2,858 |
48,290 |
19,617 |
28,673 |
| Edmunds | $1.1 |
$5.2 |
$6.3 |
1,987 |
2,735 |
63,086 |
28,016 |
35,070 |
| Faulk | $0.8 |
$5.1 |
$5.8 |
1,373 |
2,673 |
55,125 |
20,464 |
34,661 |
| Charles Mix | $1.3 |
$4.6 |
$5.8 |
2,234 |
2,406 |
43,471 |
22,134 |
21,337 |
| Potter | $1.0 |
$4.6 |
$5.6 |
1,783 |
2,406 |
65,258 |
34,582 |
30,676 |
| McPherson | $0.5 |
$4.8 |
$5.3 |
840 |
2,549 |
38,235 |
9,930 |
28,305 |
| Walworth | $0.4 |
$4.6 |
$5.0 |
758 |
2,406 |
32,546 |
9,165 |
23,381 |
| Codington | $1.6 |
$3.4 |
$4.9 |
2,725 |
1,769 |
35,689 |
21,812 |
13,877 |
| Day | $0.7 |
$3.8 |
$4.5 |
1,209 |
2,015 |
24,845 |
10,212 |
14,633 |
| Sully | $0.8 |
$2.6 |
$3.5 |
1,475 |
1,398 |
41,836 |
24,914 |
16,922 |
| Miner | $0.9 |
$2.6 |
$3.4 |
1,537 |
1,357 |
36,606 |
21,973 |
14,633 |
| Kingsbury | $0.9 |
$2.6 |
$3.4 |
1,516 |
1,357 |
28,348 |
17,864 |
10,484 |
| Sanborn | $0.6 |
$2.4 |
$3.0 |
1,106 |
1,274 |
22,092 |
11,117 |
10,975 |
| Brookings | $1.0 |
$2.0 |
$3.0 |
1,741 |
1,049 |
21,944 |
14,240 |
7,704 |
| Jerauld | $0.4 |
$2.5 |
$2.9 |
758 |
1,295 |
21,207 |
7,351 |
13,856 |
| Hutchinson | $0.8 |
$1.8 |
$2.6 |
1,414 |
945 |
24,212 |
14,300 |
9,912 |
| Campbell | $0.2 |
$2.3 |
$2.5 |
430 |
1,213 |
21,005 |
7,271 |
13,734 |
| Hamlin | $0.7 |
$1.8 |
$2.5 |
1,209 |
945 |
18,408 |
11,500 |
6,908 |
| Douglas | $0.4 |
$1.9 |
$2.3 |
778 |
1,007 |
20,181 |
9,063 |
11,118 |
| Jones | $0.4 |
$1.9 |
$2.2 |
655 |
987 |
19,270 |
8,519 |
10,751 |
| Stanley | $0.4 |
$1.6 |
$1.9 |
676 |
822 |
15,179 |
7,311 |
7,868 |
| Hyde | $0.4 |
$1.5 |
$1.9 |
717 |
802 |
14,732 |
7,150 |
7,582 |
| Lake | $0.8 |
$1.1 |
$1.9 |
1,434 |
555 |
14,110 |
10,594 |
3,516 |
| Minnehaha | $1.1 |
$0.5 |
$1.7 |
2008 |
288 |
18,054 |
16,133 |
1,921 |
| Bennett | $0.5 |
$1.1 |
$1.6 |
861 |
576 |
13,348 |
8,137 |
5,211 |
| Buffalo | $0.1 |
$1.4 |
$1.5 |
246 |
720 |
10,036 |
2,699 |
7,337 |
| McCook | $0.7 |
$0.7 |
$1.4 |
1,250 |
370 |
13,735 |
10,996 |
2,739 |
| Dewey | $0.2 |
$1.1 |
$1.3 |
389 |
576 |
10,749 |
4,128 |
6,621 |
| Marshall | $0.3 |
$1.0 |
$1.3 |
553 |
514 |
10,437 |
4,531 |
5,906 |
| Yankton | $0.5 |
$0.8 |
$1.3 |
820 |
431 |
6,661 |
2,961 |
3,700 |
| Perkins | $0.4 |
$0.8 |
$1.2 |
778 |
412 |
10,513 |
6,445 |
4,068 |
| Turner | $0.6 |
$0.6 |
$1.2 |
1,086 |
308 |
10,080 |
7,996 |
2,084 |
| Hanson | $0.4 |
$0.7 |
$1.2 |
738 |
391 |
10,248 |
6,304 |
3,944 |
| Roberts | $0.5 |
$0.7 |
$1.1 |
840 |
350 |
11,922 |
7,835 |
4,087 |
| Moody | $0.7 |
$0.4 |
$1.1 |
1,167 |
206 |
9,649 |
8,177 |
1,472 |
| Lincoln | $0.6 |
$0.4 |
$1.0 |
1,086 |
206 |
9,388 |
7,815 |
1,573 |
| Haakon | $0.4 |
$0.6 |
$1.0 |
697 |
308 |
10,594 |
7,855 |
2,739 |
| Bon Homme | $0.4 |
$0.5 |
$0.9 |
655 |
267 |
4,372 |
2,880 |
1,492 |
| Deuel | $0.4 |
$0.5 |
$0.9 |
697 |
247 |
6,692 |
4,955 |
1,737 |
| Mellette | $0.1 |
$0.7 |
$0.8 |
185 |
350 |
4,066 |
1,470 |
2,596 |
| Clay | $0.3 |
$0.4 |
$0.7 |
553 |
227 |
3,556 |
2,820 |
736 |
| Grant | $0.5 |
$0.2 |
$0.7 |
861 |
102 |
8,591 |
7,794 |
797 |
| Corson | $0.2 |
$0.4 |
$0.5 |
328 |
185 |
5,460 |
3,927 |
1,533 |
| Todd | $0.1 |
$0.4 |
$0.5 |
123 |
206 |
2,378 |
805 |
1,573 |
| Union | $0.2 |
$0.2 |
$0.4 |
410 |
102 |
4,463 |
3,666 |
797 |
| Fall River | $0.2 |
$0.2 |
$0.4 |
348 |
102 |
2,892 |
2,075 |
817 |
| Pennington | $0.2 |
$0.2 |
$0.3 |
328 |
83 |
2,249 |
1,329 |
920 |
| Harding | $0.1 |
$0.3 |
$0.3 |
102 |
144 |
2,046 |
1,269 |
777 |
| Butte | $0.2 |
$0.2 |
$0.3 |
266 |
83 |
2,168 |
1,269 |
899 |
| Jackson | $0.1 |
$0.2 |
$0.3 |
123 |
102 |
2,108 |
1,168 |
940 |
| Meade | $0.1 |
$0.2 |
$0.3 |
164 |
83 |
1,358 |
725 |
633 |
| Ziebach | $0.1 |
$0.1 |
$0.2 |
185 |
62 |
2,179 |
1,893 |
286 |
| Custer | $0.0 |
$0.1 |
$0.1 |
41 |
41 |
347 |
101 |
246 |
| Shannon | $0.0 |
$0.1 |
$0.1 |
0 |
41 |
388 |
0 |
388 |
| Lawrence | $0.0 |
$0.0 |
$0.1 |
21 |
21 |
62 |
0 |
62 |
| TOTAL | $41.2 |
$189.8 |
$231.0 |
72,471 |
100,194 |
1,831,571 |
803,634 |
1,027,937 |
*Rounded to the nearest $100,000.
